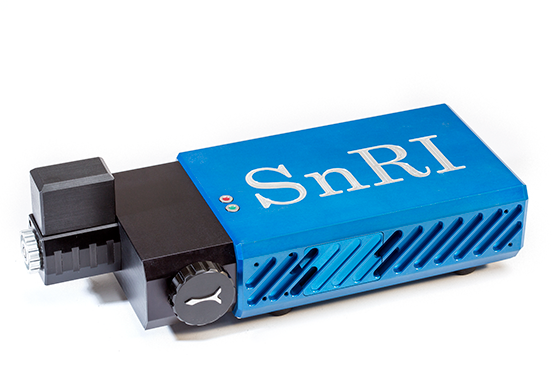
SnRI’s scientists and engineers are leaders in developing innovative Surface Enhanced Raman Scattering (SERS) platforms for researchers. We have over 30 years of experience in developing Raman instrumentation for SERS colloidal solutions and substrates. SnRI offers choice in state-of-the-art Raman platforms, software, wavelengths and sampling methods such as Orbital Raster Scanning (ORS). These systems enhance your research with a variety of off-the-shelf and custom high signal-to-noise based Raman instrumentation to choose from.
More Information – Download PDF
Improving SERS analysis with ORS
SERS stems from nanofeatures: colloidal particles or nanostructures on surfaces. It is believed that junctions between these features, termed hot spots, are locations were larger SERS intensities are observed. The spatial heterogeneity of surfaces and colloidal suspensions challenges researchers in studying SERS.
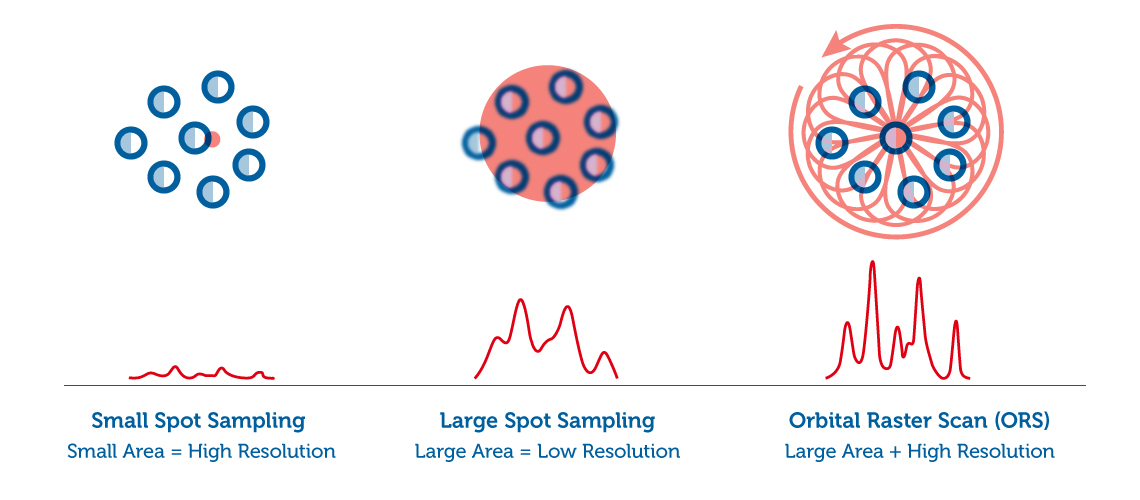
One of the characteristics of dispersive spectroscopy is the relationship between light collection and resolution. This relationship is inverse: the more light you collect the lower the resolution. This is also characterized as the etendue of the system. With conventional spectroscopic instruments a large interrogation area (large laser spot) would require a large aperture in the spectrometer to efficiently collect all of the laser light. Increasing the aperture has a negative effect on the valuable information about the material spread over the detector resulting in poor spectral resolution.
For pure samples a tightly focused laser beam and small spectrograph aperture may be sufficient. However, when the sample is heterogeneous or sensitive to the high laser power found in a tightly focused beam it is necessary to expand the beam size or reduce the laser power. One example of a patterned rastering technology that overcomes the problem of etendue loss with large interrogation areas is ORS (Orbital Raster Scan) technology.
Raster scanning provides three main advantages:
- Higher laser powers can be employed because the laser spot does not rest on the same location. Even nanoparticles in suspensions can be susceptible to sample burning over periods of time.
- Secondly the rastered beam collects data at several locations of the sample providing a more reproducible result, which eliminates “hot-spot” effects.
- It enables a very high throughput, signal-to-noise, high resolution measurement system without loss on “etendue” that can occur in a conventional Raman spectrometer.
SERS Theory
Surface Enhanced Raman Scattering (SERS) is an interesting nanomaterial method to enhance Raman signals. Under proper conditions the Raman signals from materials adsorbed to prepared nanomaterial surfaces are enhanced by over 106. This enhancements turns the medium sensitivity Raman technique into a trace technique capable of detecting and identifying single molecules.
Theory of SERS
The electromagnetic explanation for SERS can be found in textbooks on electrostatics. If one looks at the equation for the electric field surrounding a dielectric sphere it is a simple relationship between the dielectric constants of the sphere and the surrounding materials. This is illustrated below.
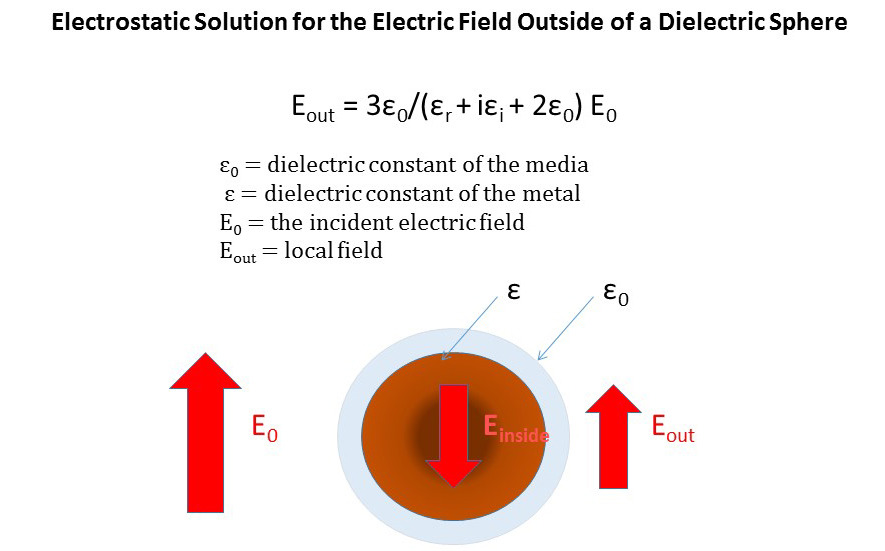
To explain this phenomenon a little more we should first ask “Why electrostatics?” SERS is only observed when the nanoparticle is on smaller than the wavelength of the laser excitation. For example, SERS nanoparticles are often < 100 nm in diameter and the laser wavelengths maybe 785 nm. This means to a first approximation the electric field of the light appears “static”.
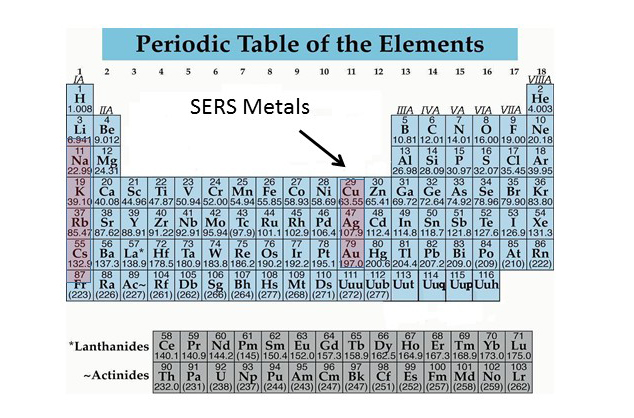
Another unusual feature of SERS is that it is limited to a small group of metals. The alkali metals have been shown to exhibit SERS, but their reactivity is far too high to be practical. Even in the Group 1B metals, copper is too reactive under most conditions. That leaves silver and gold as the most common SERS materials. The reason SERS is limited to these materials is their dielectric constant – well it is not really a constant since it changes with the wavelength of the light! Silver and gold both have negative dielectric constant at visible wavelengths. If you look at the equation above you can see that when the real dielectric constant of the metal (εr) is -2 and the dielectric constant of the surrounding (ε0) is 1 then the denominator becomes small. In fact, if the imaginary part of the metal’s dielectric constant is 0 then the electric field outside (Eout) of the particle would become infinite. The unique feature of silver and gold is that they have a full d orbital (d10) and a single s1 electron. This shielded electron is called a “free electron” and has the properties to produce a small imaginary dielectric constant and a negative real dielectric constant. The result is large electric fields around the particles relative to the small incident field of the laser excitation source.
This is a simplistic view of the SERS effect. The particle’s shape can strongly affect the enhancement, the size can dampen or shift the enhancement to longer wavelengths, and the junction between particles is believed to also be a site of extra enhancement. The final part of the SERS theory is the relationship between Raman intensities and the electric field of the light. Raman scattering is linearly related to the intensity of the laser excitation and the laser intensity is proportional to the square of the electric field of the light. With relation to Figure 1 this means that the enhanced electrical field outside the particle will enhance the Raman scattering by a power of 2. The SERS effect also gains enhancement from the induced dipole of the molecule during the Raman process, the electric field associated with this dipole will also be enhanced by a power of 2. This means that the overall SERS enhancement scales as the 4th power of the field surrounding the nanoparticle.
SERS Spectroscopy
SERS spectroscopy can be performed directly with mobile nanoparticles in solutions or on sold substrates of metals, microlithographically produces substrates, or support materials. The substrate is important and controls the amount of enhancement that is observed. However, SERS is not a universal technique. The analyte must be able to adsorb to the surface or directly to a coating on the surface.
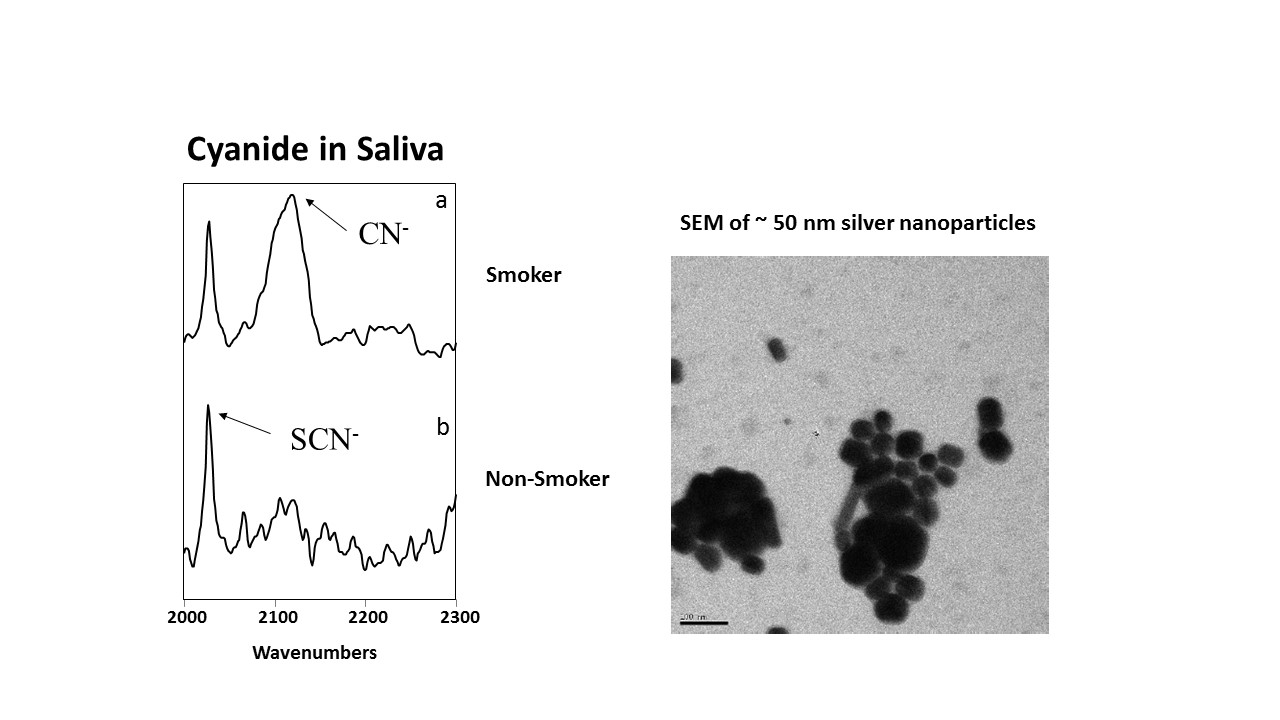
Above we illustrate an SEM of silver nanoparticles for SERS and an application of SERS. Cyanides and thiocyanides adsorb strongly to silver or gold nanoparticles. Human saliva naturally contains trace amounts of thiocyanide from foods that we eat. Tobacco smoke contains significant amounts of cyanide and trace (ppb) levels of cyanide can be detected in saliva of tobacco smokers.
For more information on how we can assist you with your SERS measurements please contact one of our sale professionals or applications scientists today.